
Confusion Matrix Explained In Details


In the world of Machine Learning, especially in classification problems, evaluating a model’s performance is crucial. Simply measuring accuracy is not always enough, especially when dealing with imbalanced datasets where one class is significantly more frequent than another. This is where performance metrics such as Precision, Recall, Specificity, and F1-Score come into play.
These metrics help in understanding how well a model predicts different classes and determine its reliability in real-world applications. Additionally, the AUC-ROC curve provides insight into how well the model distinguishes between classes, making it an essential tool for evaluation.
In this blog, we’ll explore the key performance metrics for classification problems, their significance, and when to prioritize one over the other.
Performance Metrics for Classification Problems
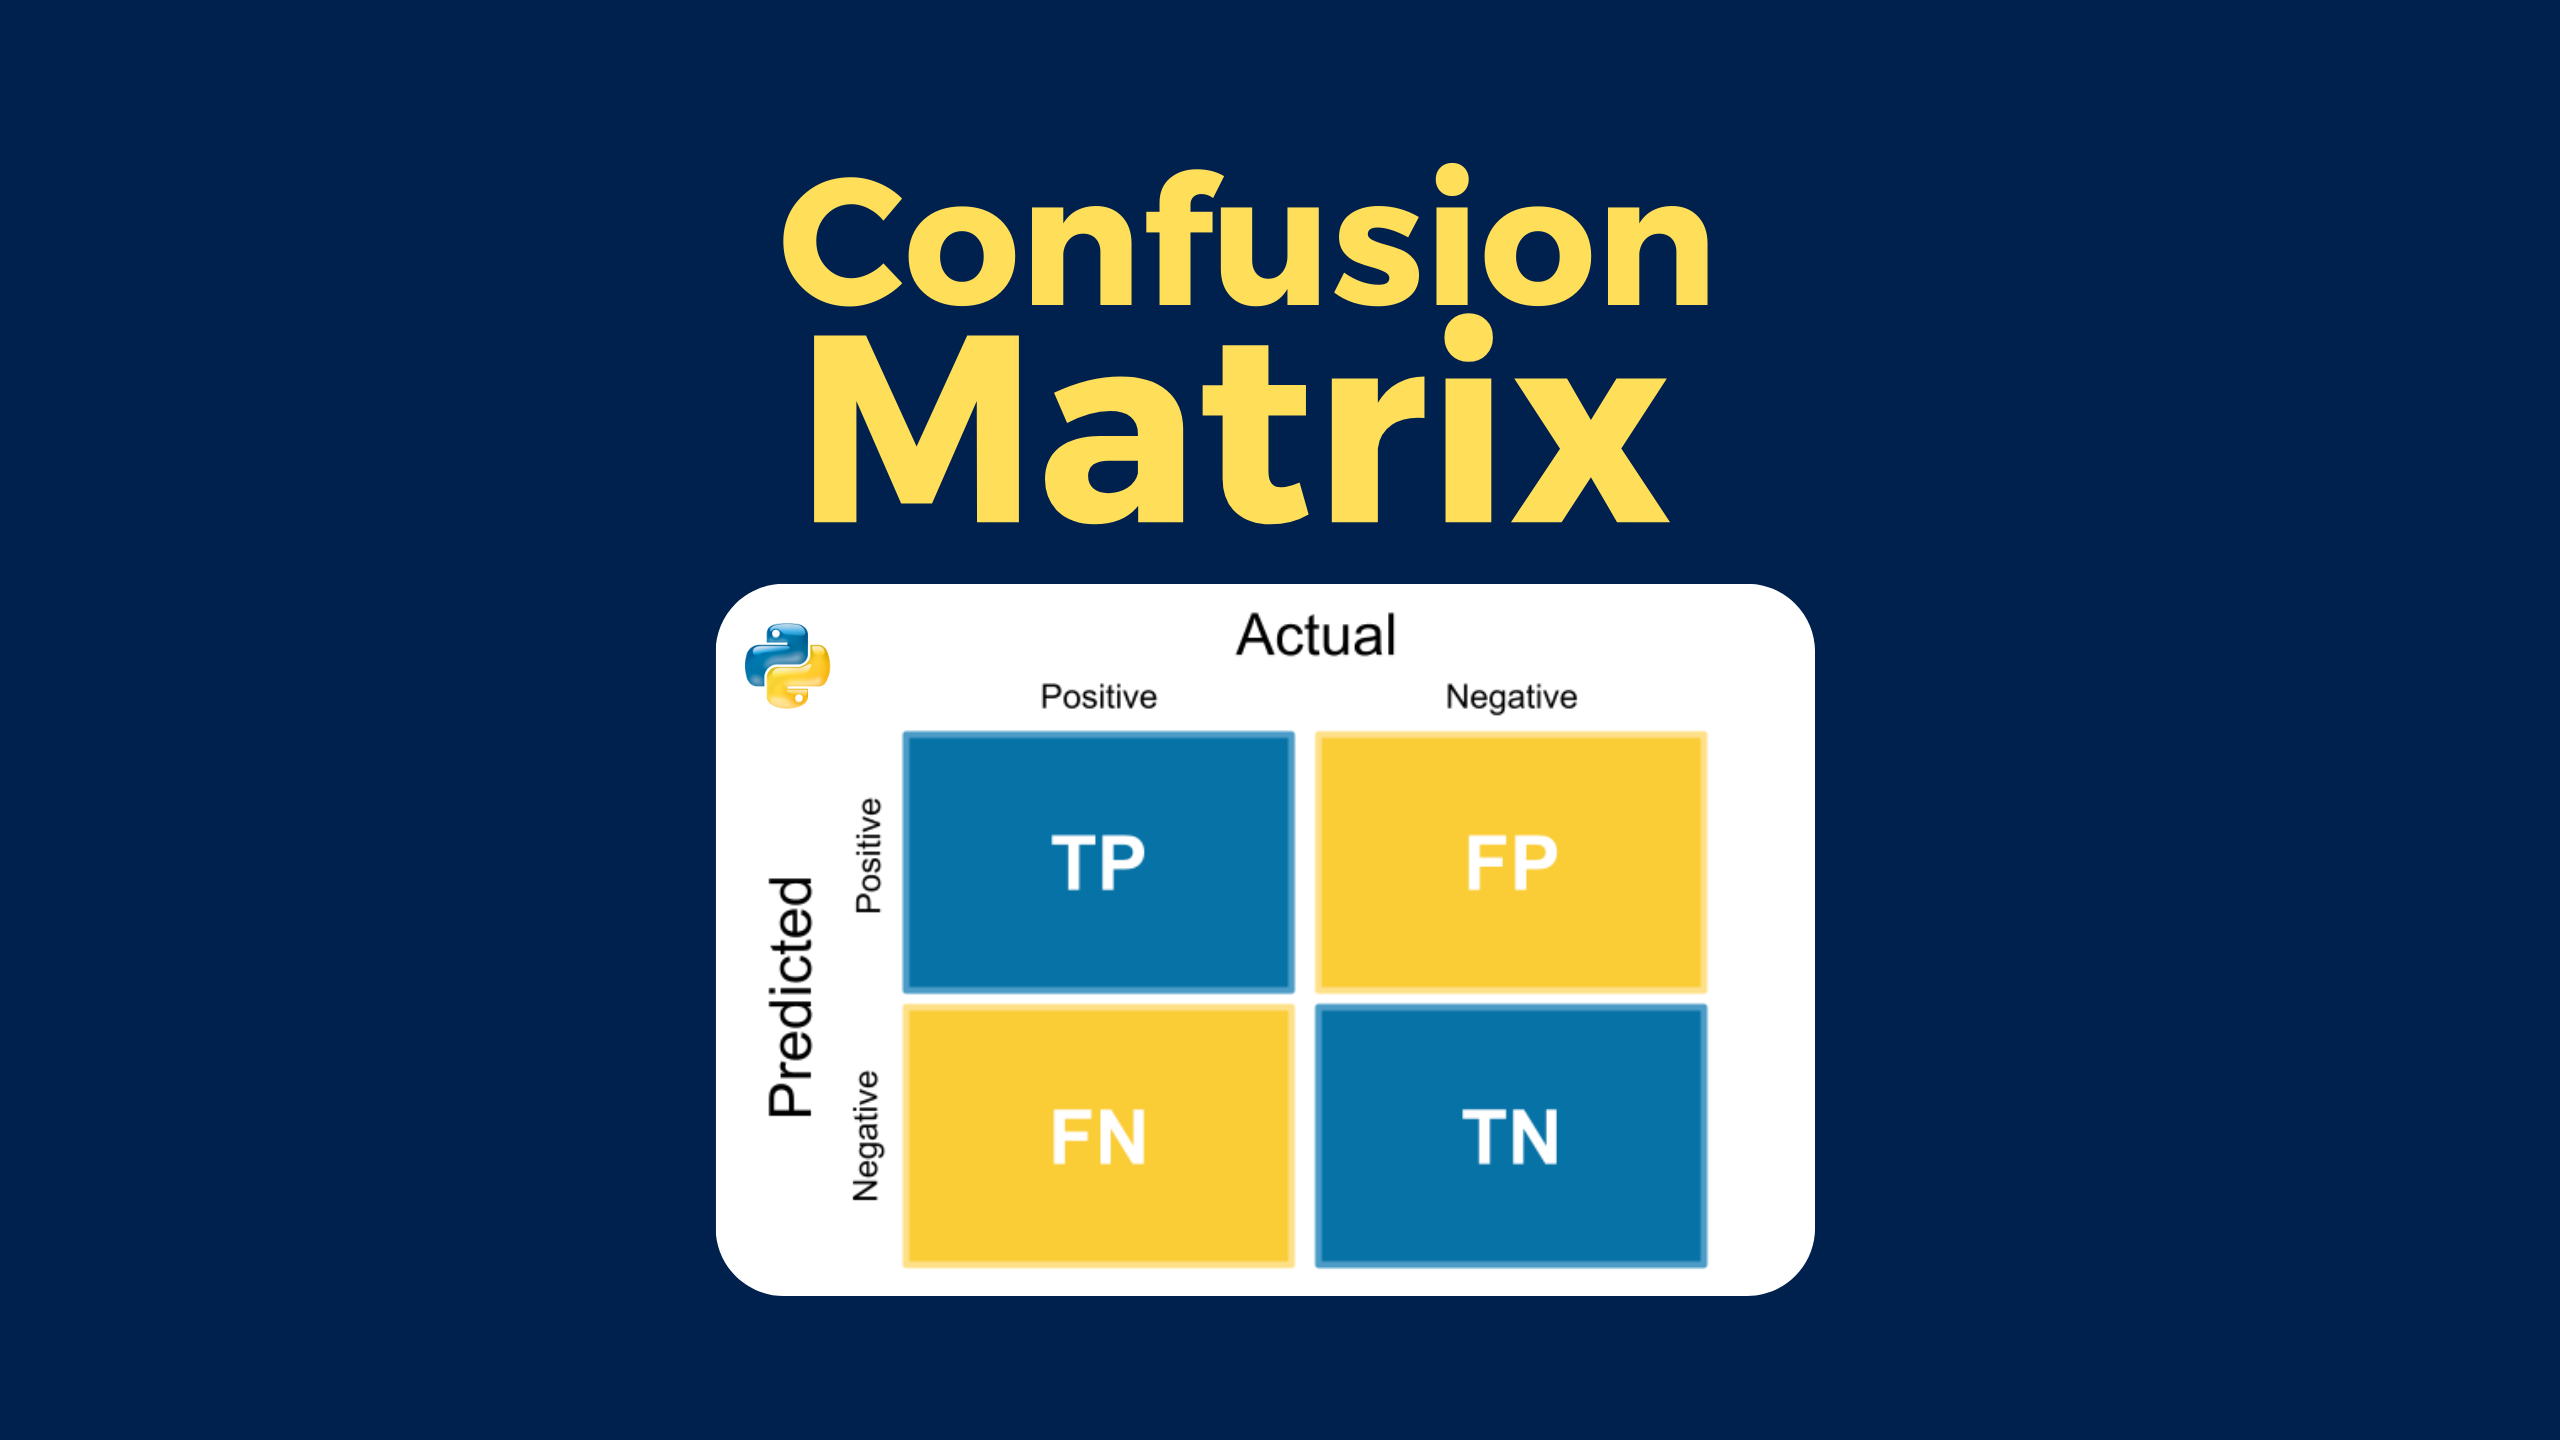
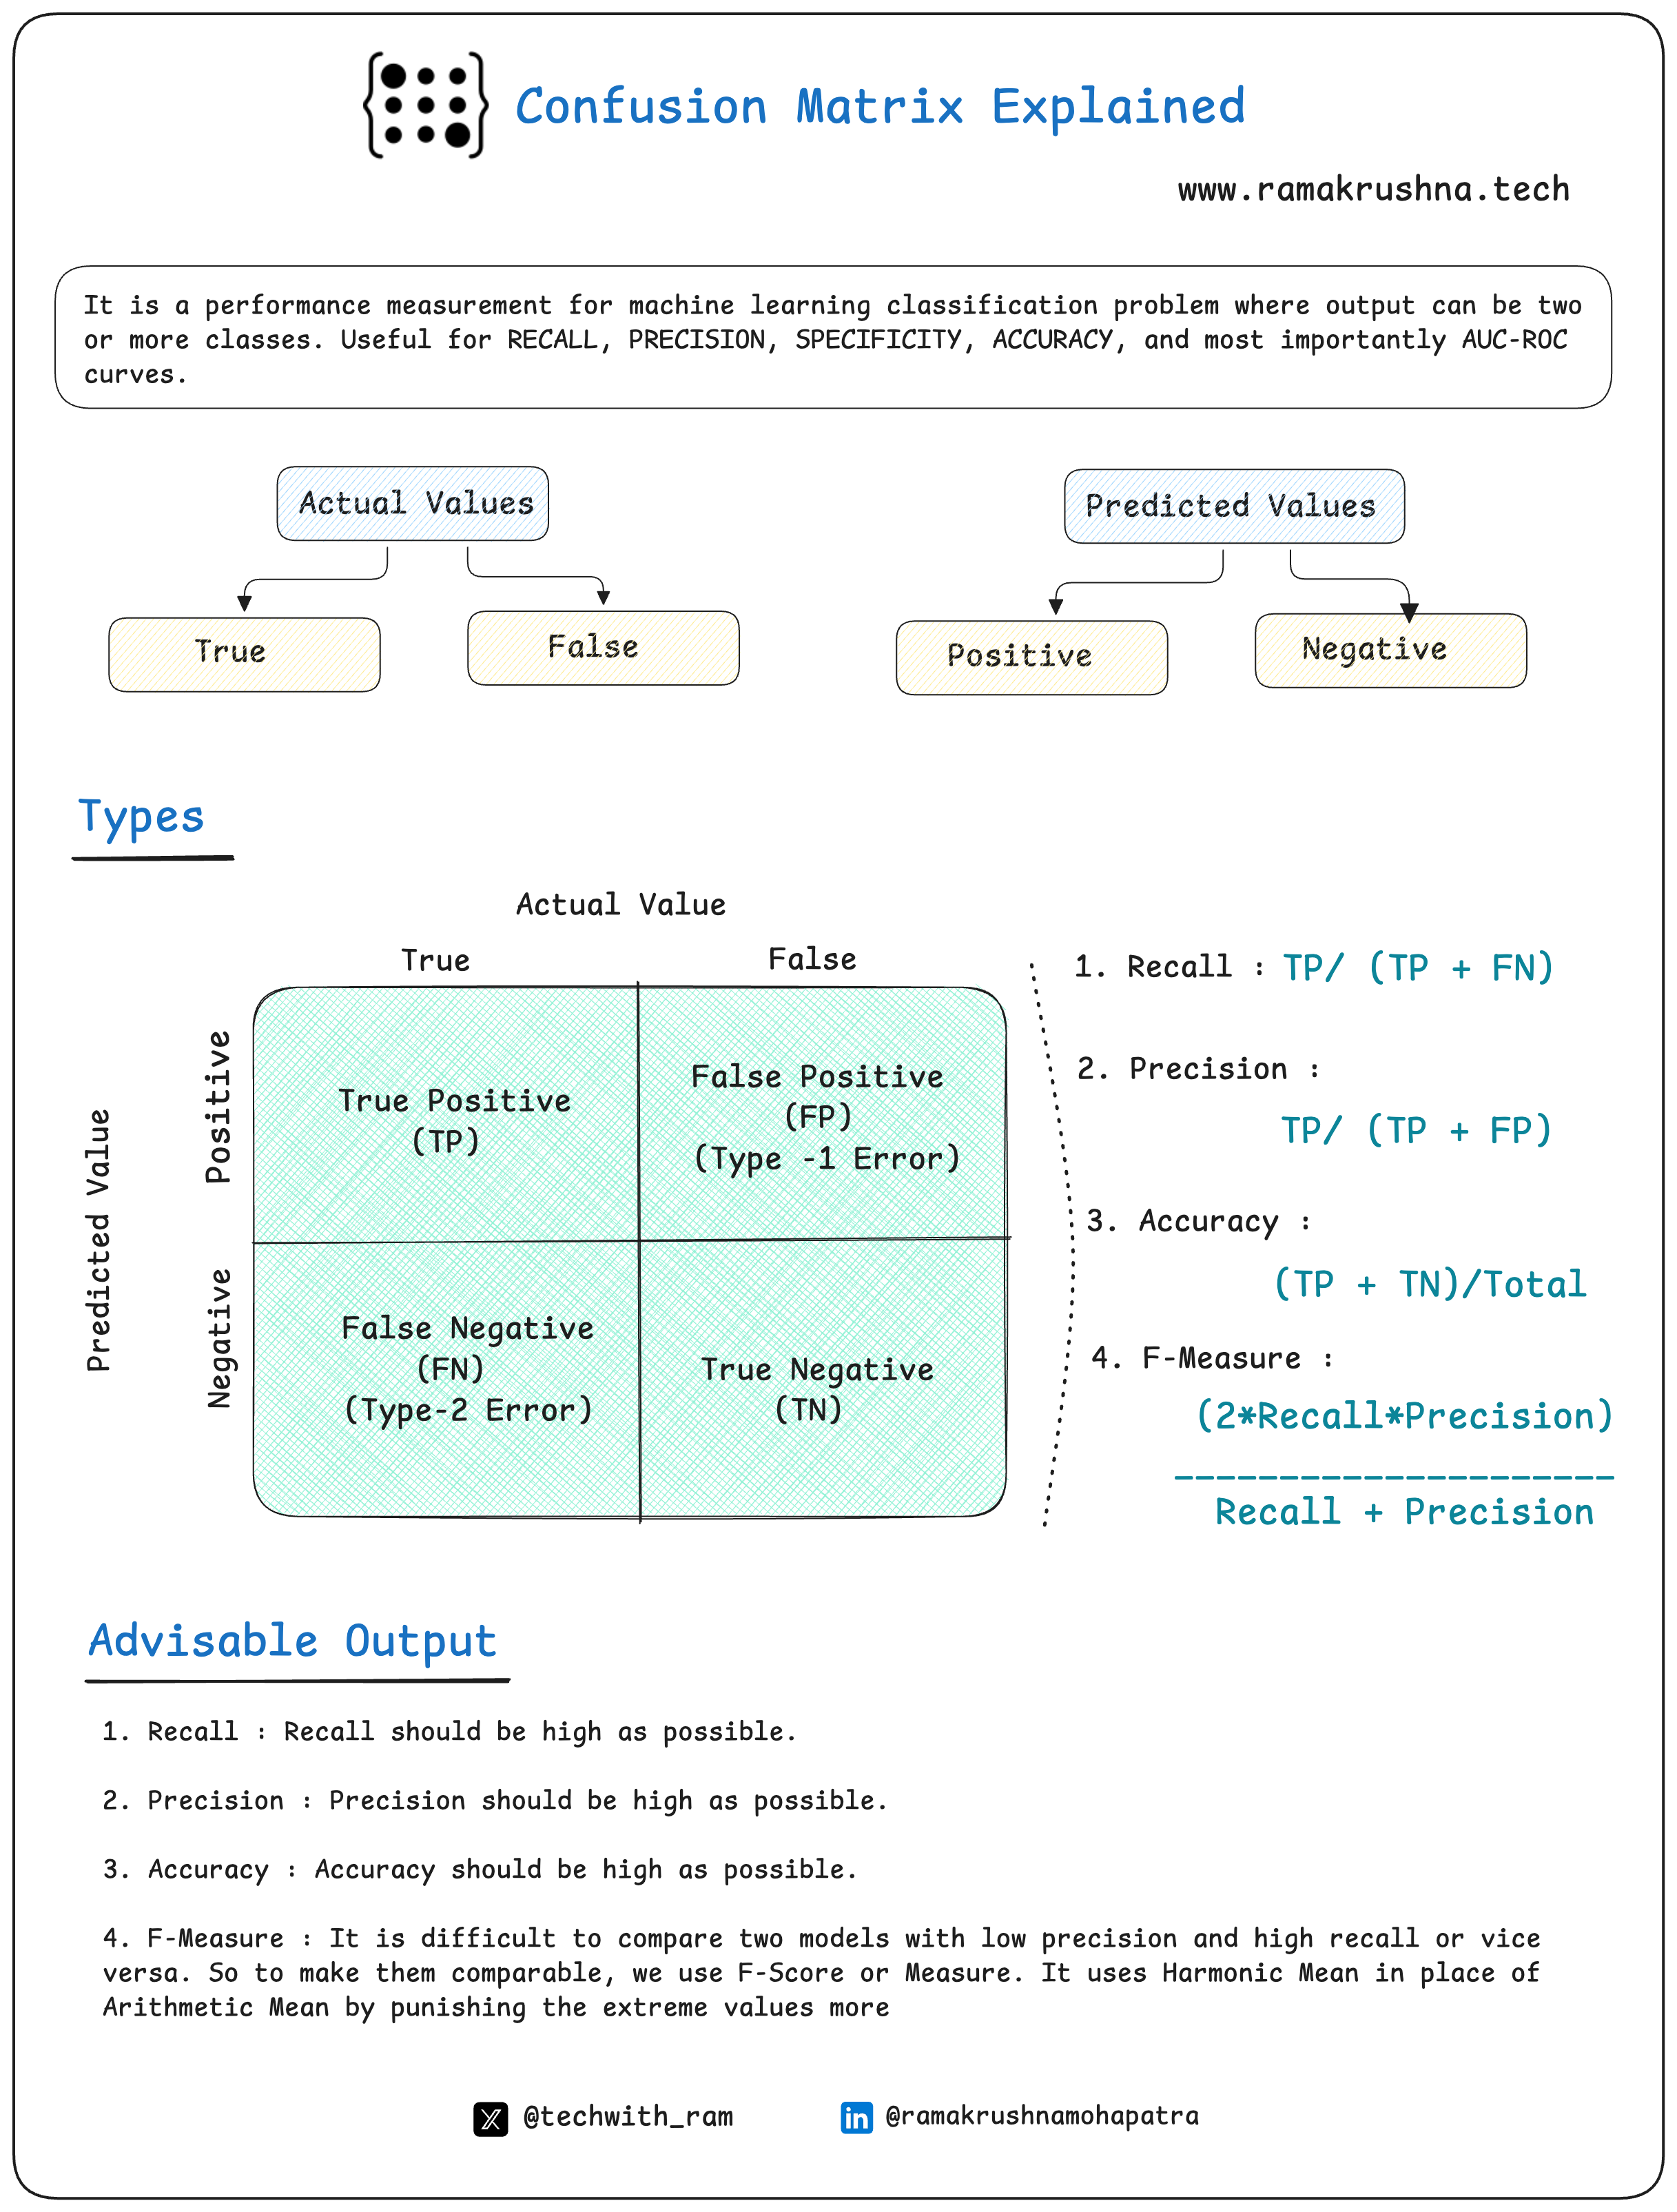
When evaluating a classification model, we typically rely on a confusion matrix, which consists of:
True Positives (TP) – Correctly predicted positive instances
False Positives (FP) (Type-I Error) – Incorrectly predicted positive instances
False Negatives (FN) (Type-II Error) – Incorrectly predicted negative instances
True Negatives (TN) – Correctly predicted negative instances
Using these values, we derive several critical performance metrics:
1. Recall (Sensitivity or True Positive Rate)
Formula: Recall = TP / (TP + FN)
Importance: Measures the ability to identify all actual positive cases.
Use Case: High recall is crucial in medical diagnosis (e.g., detecting cancer), where missing a positive case could have severe consequences.
2. Precision (Positive Predictive Value)
Formula: Precision = TP / (TP + FP)
Importance: Measures how many of the predicted positive cases are actually positive.
Use Case: High precision is essential in spam detection, where false positives (important emails classified as spam) should be minimized.
3. Accuracy
Formula: Accuracy = (TP + TN) / Total Predictions
Importance: Provides an overall measure of correctness but can be misleading if classes are imbalanced.
Use Case: Best used in balanced datasets where both classes are equally important.
4. F1-Score (Harmonic Mean of Precision & Recall)
Formula: F1-Score = (2 * Precision * Recall) / (Precision + Recall)
Importance: Useful when both Precision and Recall are important and there’s an imbalance between false positives and false negatives.
Use Case: Effective in fraud detection, where missing fraudulent transactions (FN) and misclassifying genuine transactions (FP) both have serious consequences.
5. AUC-ROC Curve (Area Under the Curve – Receiver Operating Characteristic)
Purpose: Measures the model’s ability to distinguish between classes.
How It Works: A higher AUC value indicates a better model, with 1.0 being perfect classification and 0.5 meaning random guessing.
Use Case: Widely used in binary classification tasks like credit risk assessment.
When to Prioritize Each Metric?
If False Negatives are costly (e.g., missing a disease in medical diagnosis) → Prioritize Recall
If False Positives are costly (e.g., spam classification, fraud detection) → Prioritize Precision
If you need a balance between Precision & Recall → Use F1-Score
If you need an overall performance measure → Use Accuracy (only when classes are balanced)
If you want to compare models effectively → Use AUC-ROC Curve
Conclusion
Selecting the right performance metric is crucial for building an effective classification model. While accuracy may seem like a simple go-to metric, relying on it alone can be misleading, especially in imbalanced datasets. Metrics like Recall, Precision, F1-Score, and AUC-ROC provide a more detailed understanding of a model’s effectiveness.
Key Takeaway: Always choose the metric that aligns with your business goals and problem statement. In high-risk scenarios like healthcare or fraud detection, false negatives or false positives can have severe consequences, so prioritizing the right metric is essential for making informed decisions. 🚀
 | A guest post by
|